

Description
Download Proof | Jeff Cooper& David Reif – Unlocking the Profits of the New Swing Chart Method (5.37)
![]()
Jeff Cooper& David Reif – Unlocking the Profits of the New Swing Chart Method
Unlocking the Profits of the New Swing Chart Method by Jeff Cooper and David Reif is a comprehensive course designed to enhance traders’ abilities through a revolutionary trend visualization technique. This method integrates traditional swing charting with the element of time, offering a clearer perspective on market movements.
Course Content and Structure
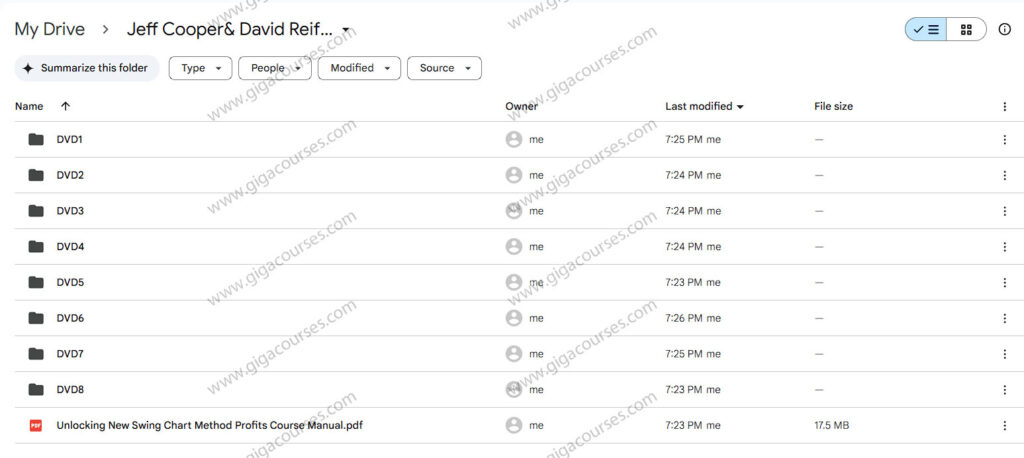
The course comprises sixteen hours of video instruction, supplemented by a reference manual containing over 300 full-color charts. The content is organized to guide traders from foundational concepts to advanced applications, ensuring a thorough understanding of the swing chart method.
Innovative Trend Visualization
At the heart of this course is a groundbreaking trend visualization method that applies the value of time to traditional swing charting. This approach, combined with Gann’s Square of 9 theory, reveals the underlying mechanisms driving market trends, providing traders with actionable buy and sell signals.
Historical Market Analysis
The authors validate their method by analyzing the Dow Jones Industrial Average from the 1920s to the present. This historical perspective demonstrates the method’s effectiveness across various market conditions and time periods.
Practical Applications
The course offers real-world examples, illustrating how the swing chart method can be applied to different financial markets, including stocks, bonds, and commodities. These practical insights enable traders to implement the techniques in their own trading strategies effectively.
User Experience and Accessibility
The inclusion of a navigation menu allows users to easily access specific charts and topics within the course. This user-friendly design enhances the learning experience, making it convenient for traders to reference materials as needed.
Conclusion
Unlocking the Profits of the New Swing Chart Method is a valuable resource for traders seeking to improve their market analysis skills. The course’s innovative approach to trend visualization, combined with practical applications and historical analyses, provides a comprehensive toolkit for enhancing trading accuracy and profitability.